May 31st, 2017
38 Degrees – Election Vote Quiz
By Robin Priestley
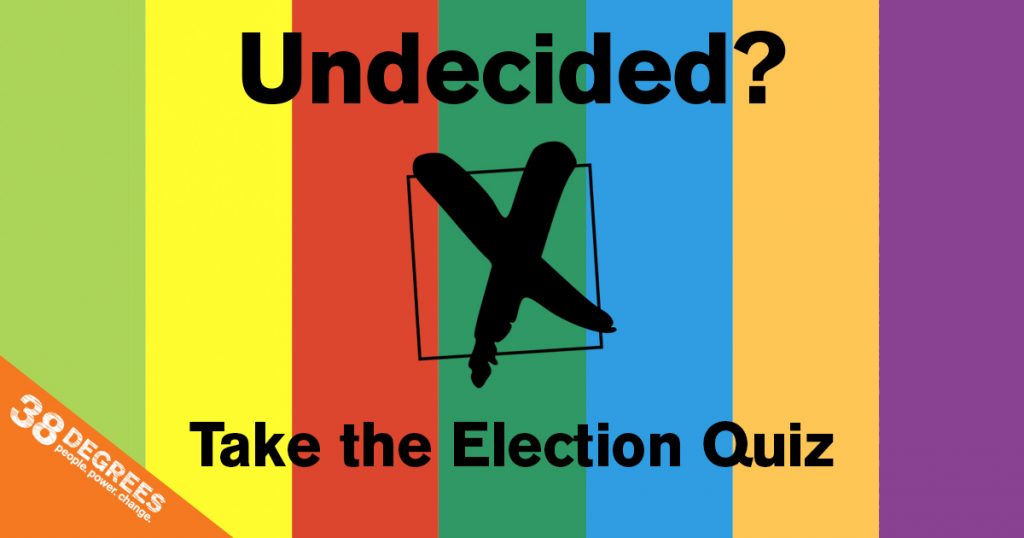
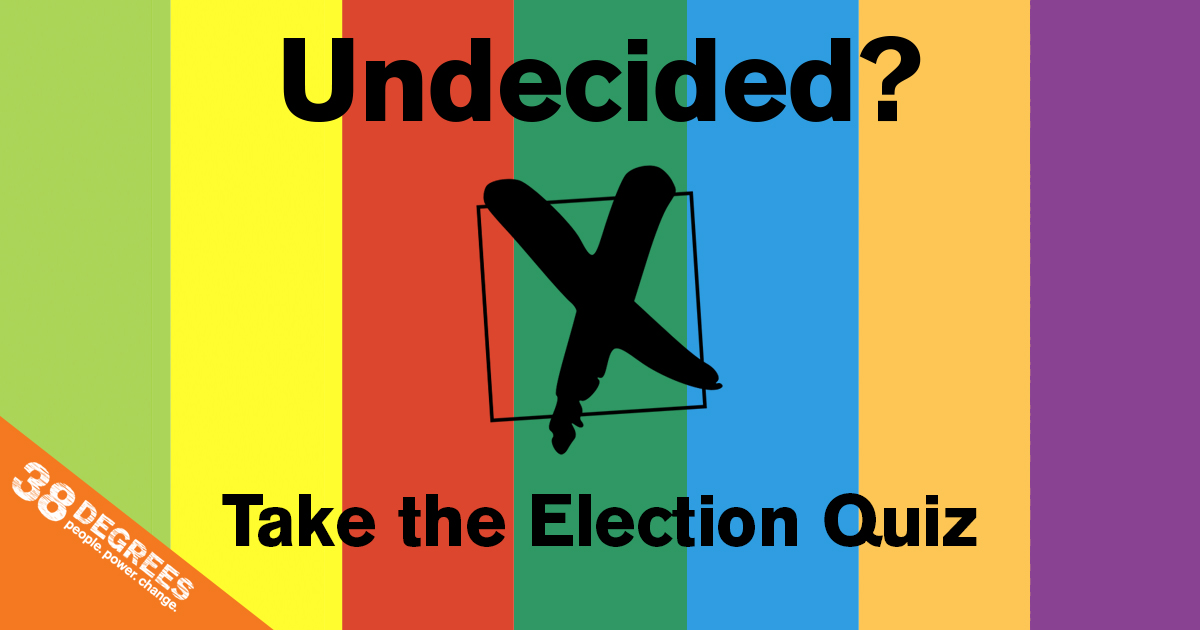
Would you like to know which political party actually stands for what you believe in?
Click here to take a quiz matching your views to the promises from each political party. You may be surprised by the results!
The election is just one week away. There are so many sound-bites flying around it can hard to tell who actually stands for what.
To build this quiz, 38 Degrees teamed up with an independent company specialising in election fact checking. It compares your views to each of the main parties, so you can see who you might agree with the most. It only takes a few minutes and it’s a fun way to get beyond the spin and see what the political parties are promising.
FAQs:
How did you pick the questions?
The questions in the quiz are a mix of the top issues this election, and issues that 38 Degrees members have campaigned a lot on already.
Who made the quiz?
Explaain are a company that 38 Degrees have commissioned to build this vote quiz. Here’s a quick set of questions and answers with them to explain who they are and how they made the quiz work:
Who are Explaain?
Explaain LTD., the company behind GE2017.com, is a private limited company limited by shares. We are financed by selling our software to customers as well as funds provided by Google (through the Digital News Initiative) and the European Union (via the Horizon 2020 grant). Our only shareholders are the company’s co-founders, Jeremy Evans (jeremy@explaain.com) and Matthew Morley (matt@explaain.com)
Our neutrality is ensured in 3 ways:
- We’re a partner of the largest nonpartisan fact checking network in the world (First Draft News) where we sit alongside other reputable names including Full Fact and the BBC Reality Check Team. Like them, we adhere to strict evidence based research approach and keep a unique record of considered material showing how information we present to the public is reached in a well researched manner.
- We declare our funding up front (as we’ve done above) and have to agree to strict non-partisan agreements in order to receive the funding. There are no vested interests controlling the information we produce nor how we calculate the decisions and recommendations we make.
- We’re a firm believer in transparency so are open to criticism on social media and email (hello@explaain.com) where we always reply, typically within an hour. In addition our core technology stack is based on open data (like CityMapper is with transport data) with our own proprietary technology making it easier to navigate this information. At any point any user can request access to the open data we’re referencing.
How to Explaain decide where to plot the parties depending on the answers to the questions?
This voter advice application (VAA) is created using a blend of various political science methods, many of which have been in use and tested since the 1980’a. These include ensuring that questions are free from bias, responses from questions alternate numerically so that all ‘Yes’ answers don’t respond to liberal values and more. However this year we’re able to make matches more accurate without detracting from the differences between the answers. We do this using a technique known as ‘nuance’ which was developed specifically by Explaain for this election.
Rather than a 5 point scale that relies on an anchor point of a ‘Strongly Disagree’ and ‘Strongly Agree’ at either end, nuance includes the responses in the answer exactly the same way we think and talk about them. For example ‘Should Cannabis be legalised’ will often prompt the response ‘under what conditions, for whom’ etc. By creating answers such as ‘Yes, for medical use only’ we’re able to match to parties whilst making the content more engaging and conversational to the end user.
Once we’ve read the manifestos and created the fact cards, we go about constructing responses and then assigning a numerical value to each response. These numerical values are still on a scale but are slightly more subtle in how they distinguish the minute differences between parties. A user does not need to give a ‘nuanced’ answer and can instead opt for a ‘yes’ or ‘no’ answer if they don’t have a particular view or want to progress at a faster rate. Currently nuanced answers account for over 70% of current responses and provide the best match so we’re confident they are the best of both worlds.
How do they calculate constituency data such as the chance of a party winning in an area?
We use the following data to calculate marginality and probability of winning in a seat:
- General Election 2015 results (who won, the turnout, the margin, and relevant demographic data eg. average age)
- Change in results over time – are there trends such as a ‘shock’ win or loss by any party that needs to be factored in.
- Local betting odds for roughly ⅓ rd of all seats.
- EU referendum results – constituency level
- EU referendum results – how the MP voted
Stretch goals we’re aiming for by June 1st:
- Local council results
- Select opinion polls – we’ll most likely be using the ‘poll of polls’
- Additional ONS data allowing us to predict the impact of a particular age group voting/not voting.